If you want to make the most of analytics tools, you have to understand what metrics exist and how to interpret them. We set up a small glossary to help you understand what Stock Performer provides you and how to best benefit from it.
Revenue per Download (RPD)
What is it?
It represents the average revenue for a file per sale. In the microstock context, one sale is equivalent to one download.
An Example
If an image has $200 total revenue and it sold 25 times, then it has an RPD of $200 / 25 = $8. On average you’ve earned $8 per each sale/download.
Why is it useful?
The RPD indicates how much a customer is prepared to pay for an image. If the RPD value is high, that means that customers consistently buy larger sizes of that image. The same applies to a collection. If a collection has a high RPD, that means that customers are buying the images in large sizes, or the collection contains a good amount of premium priced images.
Some images, like landscapes and architecture images, tend to sell in large sizes, since customers buy them for print. Use the RPD to find which of your images are selling in large sizes and make sure you produce more such images, since they bring more money!
How do we calculate it?
We divide the image’s total revenue by the number of downloads it has. This tells us what the average revenue per download is. For collections we average the value across all images of the collection.
Where is it used?
We display this value for each one of your uploads in the upload’s detail view. We also display it for each collection in the Collections overview and the collection’s individual view.

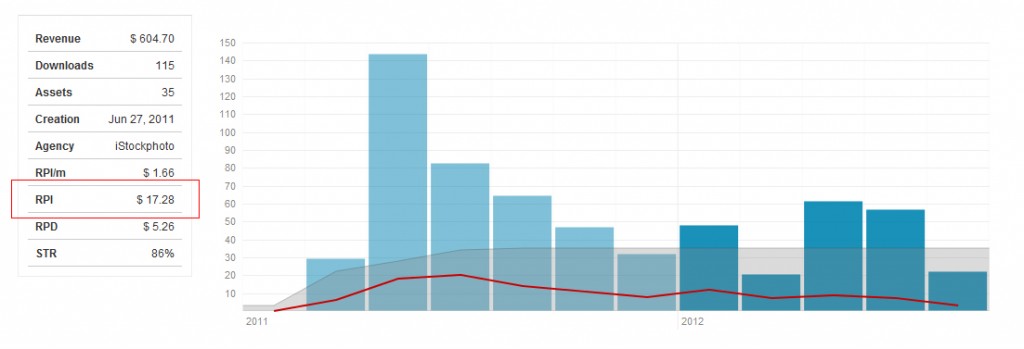
Revenue per Image (RPI)
What is it?
The average amount of revenue an image generates, when that image is grouped with other images; for instance images of the same collection or all images in a portfolio.
An Example
If you have a collection with 50 images and that collection has a total revenue of $700. Then we say that collection has an RPI of $700 / 50 = $14.
Why is it useful?
Some collections have lots of images and others only have a few. To evaluate how successful a collection of images is, you want to know how much each individual image is generating. If the collection’s images are good, each image will generate a lot of money. If the images are not so attractive for customers, then each image will produce a low revenue. This allows you to compare collections and identify what collections are strong. You should focus your production energy on such images.
How do we calculate it?
The RPI is calculated by dividing a collection’s total revenue by the number of images in that collection.
Where is it used?
We display your RPI for each Collection. Go to the Collections overview or to an individual collection to find it.

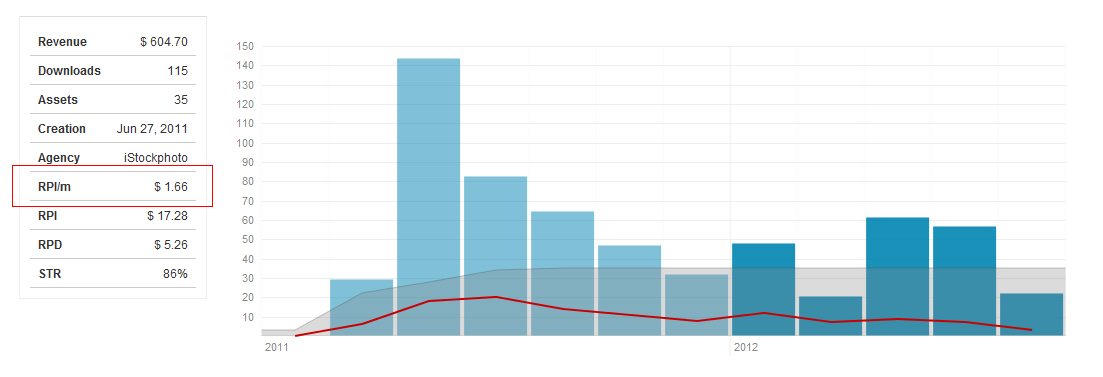
Revenue per Image per Month (RPI/m)
What is it?
It takes the RPI of an image collection and breaks it down to it’s monthly average.
An Example
If you have a collection with 50 images, which is 5 months old and that collection has a total revenue of $700: then we say that collection has an RPI/m of $700 / 50 / 5 = $2.8.
Why is it useful?
Comparing two collections is difficult, since some collections have lots of images, others less, and some have been around for a long time and others are brand new. The RPI/m allows us to break down the value of a collection into a value which can be compared across collections. We find how much revenue each image generates each month on average. This value then makes it very easy to compare two or more collections.
If for example one collection generates $2 per image each month, and another one generates $4 per image each month, then you know that the collection with the higher RPI/m contains more attractive images.
How do we calculate it?
We determine how old each image of a collection is, and then calculate how much each image has produced in each month of it’s life. We average it across all images of the collection thus producing the RPI/m.
Where is it used?
We display your RPI/m for each Collection. Go to the Collections overview or to an individual collection to find it.

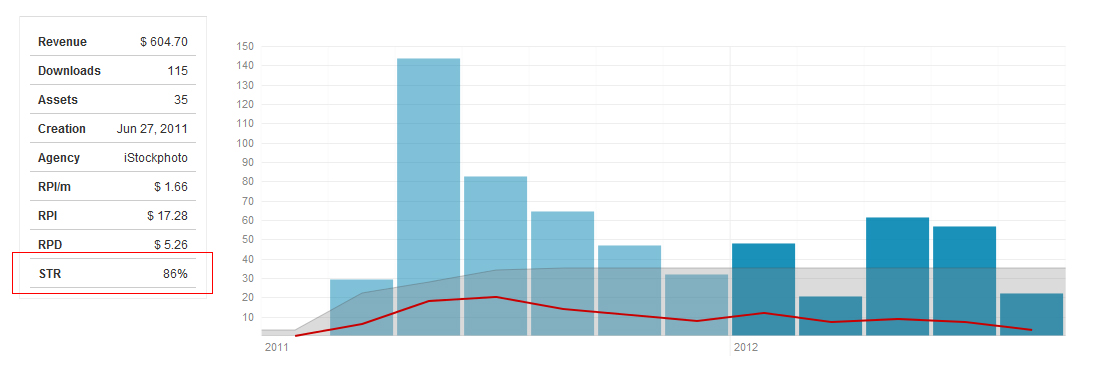
Sell Through Rate (STR)
What is it?
Sell Through Rate. This is a common metric in the retail business (supermarkets, clothes shops, etc…). It indicates what percentage of a collection has sold at least once.
An Example
Suppose you have a collection of 50 images. Of those 50 images, 15 have at least one download and 35 have no downloads at all. Then the STR is 15 / 50 = 30%.
Why is it useful?
The STR indicates how attractive your collection is. If many images have sold at least once, then you know that the collection as a whole appeals to buyers. If your collection has a low STR, that means many images remain unsold and the collection is not attractive. Explore what collections have good STR values and try to produce more images like that.
How do we calculate it?
We count how many assets in a collection have at least one download. We transform that into a percentage value which indicates the percentage of assets in a collection which have sold at least once.
Where is it used?
We display this value on the Collections overview and in the individual collection page.

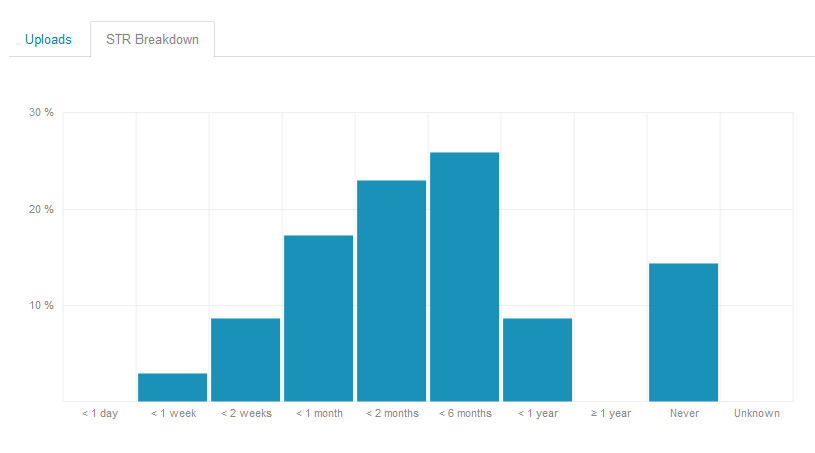
STR Breakdown
What is it?
Sell Through Rate Breakdown. It is a more detailed view of the Sell Through Rate. We break down the STR displaying how long it takes for each file to make their first sale. We show what percentage of assets have sold within one week, within two weeks, within one month, within 2 months, 6 months, one year and never sold.
An Example
Suppose you have a collection of 50 images. Of those 50 images, 15 have at least one download and 35 have no downloads at all. Of the 15 downloads, 5 of them sold within 1 week and the remaining 10 sold within 1 month. We would then say, that your 1 week STR is 10% and your 1 month STR is 20%.
Why is it useful?
The STR as described above has the disadvantage that as a collection grows older, the more files have at least one sale and the less meaningful the STR percentage value becomes. It converges towards 100% and then it becomes useless. That’s why the STR breakdown is very useful regardless how old a collection is.
You can see in the STR Breakdown chart how long it takes for the collection’s assets to make their first sale. If your files sell within a short time after upload, that means that they are very appealing to customers. If they don’t sell very fast, then you probably have an unappealing collection.
How do we calculate it?
We check for each image what its upload date is and what its first sale date is. This tells us how long it took for that image to sell for the first time. We use that information to build the chart.
Where is it used?
You find the STR Breakdown for each collection in the collection’s individual view.

Which metrics do you find most important to analyse your microstock sales?
Disclaimer: Screenshots show data from Stock Performer co-founder: Luis Alvarez. We never display user data without user’s written permission

Thanks a lot of these metrics assume we have created collections? These collections grouped at the stock agency level or on the stock performer dashboard? Also is there an article on how to interpret other stats on the dashboard like uploads, top sales, sales over time etc. I think the real value is having contributors that want aggregated patterns to opt in to share their data. Since stock performer has the data on their servers more generalize patterns could be created using larger sample data.