We’ve been busy at Stock Performer! Over a month ago we released support for iStockphoto’s Getty and Partner Program sales. The new feature had created a lot of interest and new user questions arose. So we decided to expand the functionality and are proud to introduce a series of new features for better visualizing your Getty and Partner Program sales!
When we speak of Getty Images sales, we mean sales of your E+, Agency and Vetta images on Getty Images.
Downloading your data
We have simplified the way you download your Getty and Partner Program sales. You now see new download buttons on the left.
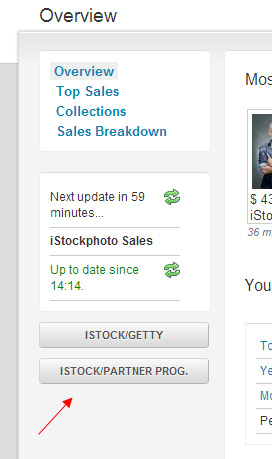
Chart Filters
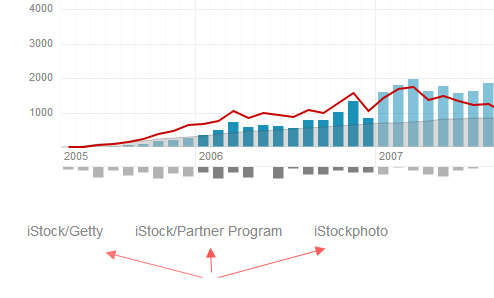
All charts now allow you to filter between the overall sales view and the individual sales of iStockphoto, Getty Images and Partner Program. The filters appear as follow:
Individual Monthly Summary Reports
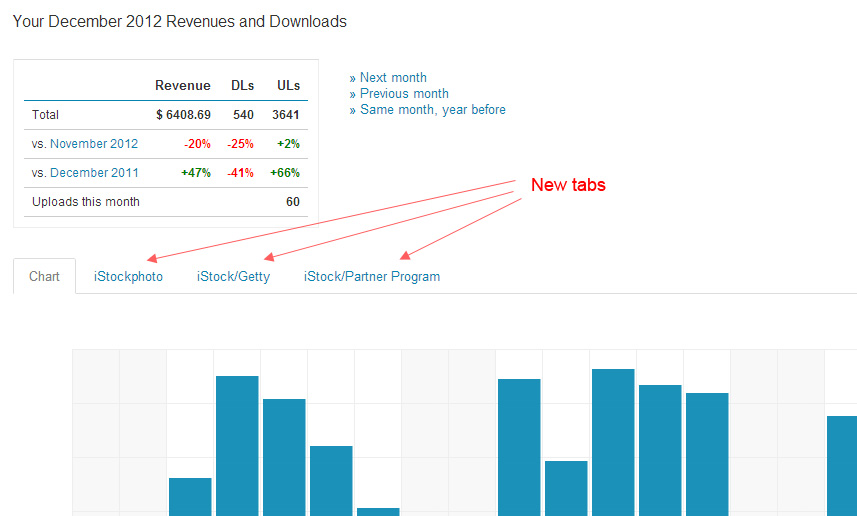
Until now, the monthly view showed you an overview summary on the top. We have now added new tabs, one for iStockphoto, one for Getty Images and one for Partner Program. In them will see specific summaries for each of those agencies.
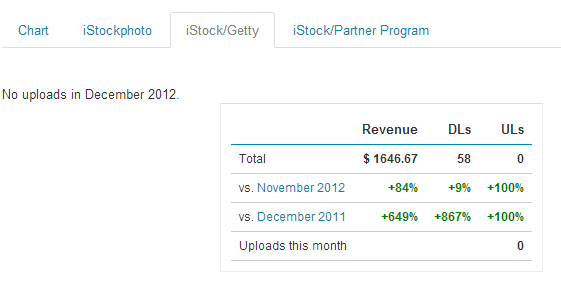
Here you see the summary only for iStock/Getty sales.
Top Sales for Getty and Partner Program
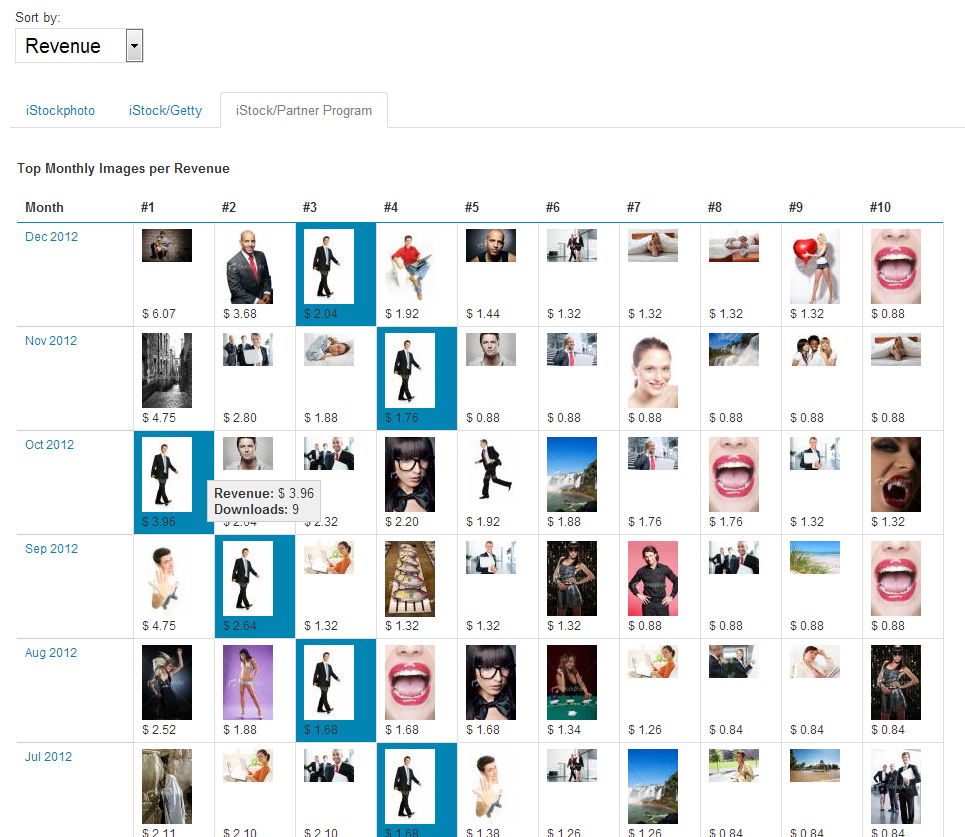
A most requested feature was to see the Top Sales of your files on both Getty Images and the Partner Program. That request has been heard and you can now see such Top Sales information. The new tabs will allow you to switch between the agencies. In the following screenshot, you see my top sales on the Partner Program.
Sales Breakdown by Distribution Channel
Sales on the Partner Program take place either on Thinkstock or on Photos.com. Sales on Getty Images, take place on Getty Images, Jupiter Images or on Getty’s Partner Portals. This is what we call the distribution channels. You can see them clearly in our new Sales Breakdown by Distribution Channel:

With this feature you can clearly see how much is selling on Thinkstock or Photos.com. You can even compare them! Here an example of a comparison between Thinkstock and Photos.com for my sales:

If you weren’t already familiar with our chart comparison tool, here is a screenshot which shows how it works. Hover your mouse over the chart’s filter option, and press on the “+” sign.

Collection Charts for Getty Images and Partner Program
Until now we presented collection sales as a mix of iStockphoto, Getty Images and Partner Program sales. In this new version, we now seperate them into individual collections, so that you can see how much each collection makes at the different places and what their top sellers are. To use this feature please download your iStockphoto collections again!
For example, my iStockalypse Berlin 2012 shoot has collected $1514 on iStockphoto and $212 on Getty Images. By checking the checkboxes on the collection’s left, Stock Performer will automatically sum up the values for you! Here you have an example:

Sales Breakdown by Size
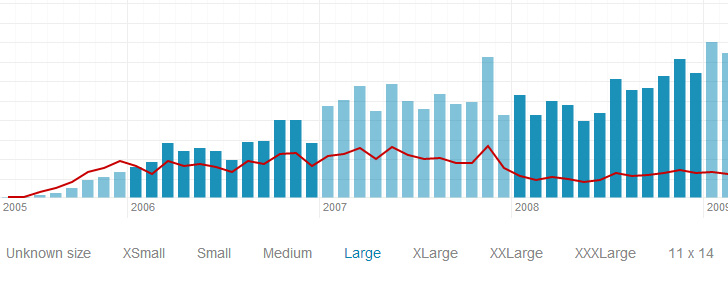
For the agencies iStockphoto and 123RF, we added a Sales Breakdown by Size. Fotolia will be added in the near future.
Thanks for your feedback, enjoy the new features!
Keep that feedback coming to us! Let us know how you find the new features!